How does the UK fit into the global context?
Global Overview
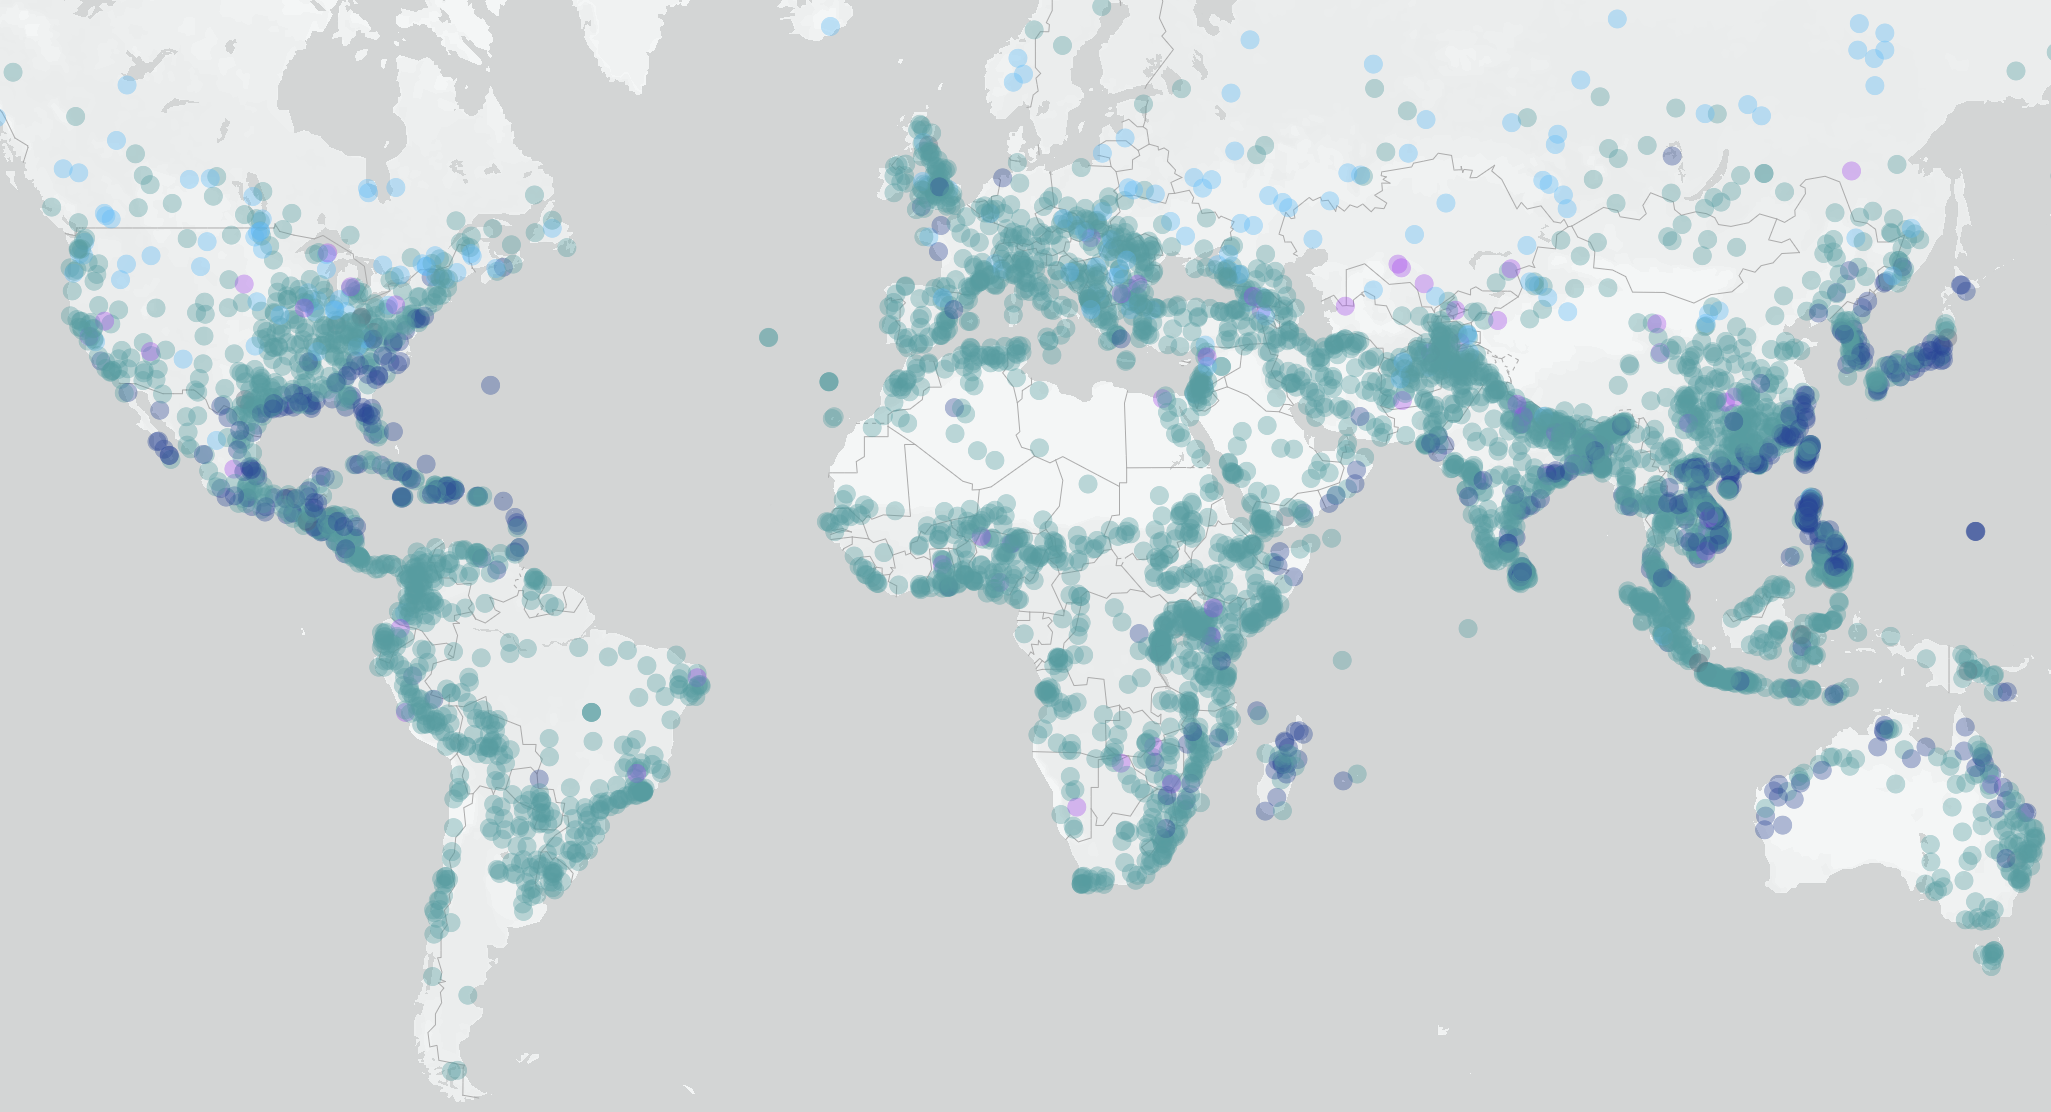
Floods are spatially very unequally distributed. While some parts of the world experience frequent and deadly floods, others are entirely flood-free. To situate flooding in the UK into the global context, use this visualisation to get an overview of all large flood events occuring since 1985 based on data from Dartmouth Flood Observatory[4]. Large flooding events are defined as those inflicting significant damage to structures or agriculture or causing fatalities. The visualisation allows you to see the global flooding trends, zoom in and explore specific flooding events in more detail or select a region and see all the floods that have affected it.
Why is the UK so exposed?
Increasing Rainfall
"In the kitchen there was about six feet of water and in the living room there was about five feet. We couldn't save anything."
The UK is especially vulnerable to flooding events due to increasing extreme-rainfall events similar to Storm Dennis. MET Office data[6] has revealed that, in 2019, UK rainfall was over double the 1961–1990 average.
According to Sir James Bevan, Chief Executive of the Environment Agency[7], flooding from surface water flooding (as well as rivers) due to heavy rainfall like this is an ever-growing, unpredictable threat.
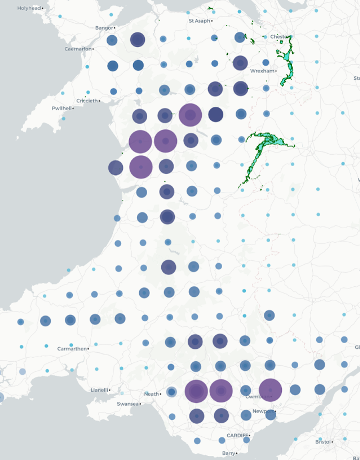
Use this tool to explore the trends of extreme rainfall at the regional scale of North Wales over the last 80 years. Note that whilst there is large variation in the trends for individual months, there is a definite increase in extreme rainfall events with all months considered.
Though the trend is gradual, a UK climate risk assessment[8] predicts that, if global warming goes unmitigated, the number of people at high risk of flooding could double by the 2050s.
How is the UK population impacted by these floods?
Population Vulnerability
How badly people will be affected will depend not just on their exposure to the floods, but on their social vulnerability – that is, how well they are able to cope with and respond to events. Social vulnerability relates to[9]:
- Personal features of the individual, which affect sensitivity to climate impacts
- Environmental characteristics, which can increase or offset exposure to flooding or heat
- Social and institutional context, which affect people’s ability to adapt
The map plots the indices of different social aspects of vulnerability to floods in various output areas in the UK, for analyzing the source of population vulnerability. Urban areas and population density are provided as additional insights. Categorical indices represent different coping abilities in the face of floods, thus reflecting in what way and to what extent a local area is socially vulnerable.How is the UK responding to this risk?
Local Flood Defenses
In London, 1.25 million people live and work in areas with flood risk from river and sea. Another 165,000 people are at medium risk of flooding from rainfall. Because London is located in the low-lying plain area of the river mouth, it is threatened by multiple floods from rivers, oceans and rainstorms. Naturally occurring floods can be difficult to prevent, however, effective control is required to significantly reduce the impacts socially, economically and environmentally. The London flood defence system was established in 1982, and has been continuously upgraded and expended until now. What areas in London is under flood risk and how well is London protected by flood defences? This map presents data about London historical flood, the areas under flood risk, all flood defense facilities and areas benefiting from them.
Am I at Risk?
Flood Risk AR
The augmented reality (AR) web application shows which flood risk zone the current location is in. Acquiring GPS location information from your smartphone, the app allows you to interactively check the flood zone, flood alert and flood history of the locations around you. For flood zones, Very Low means less than 0.1% of flood probability for a year; Low: 0.1-1%; Medium: 1-3.3%; High: more than 3.3%. The app performs well smartphones and supports both, iOS and Android OS.